The Challenge
Blink Analytics needed to present complex data analytics concepts in an engaging, comprehensible way to non-technical business decision-makers.
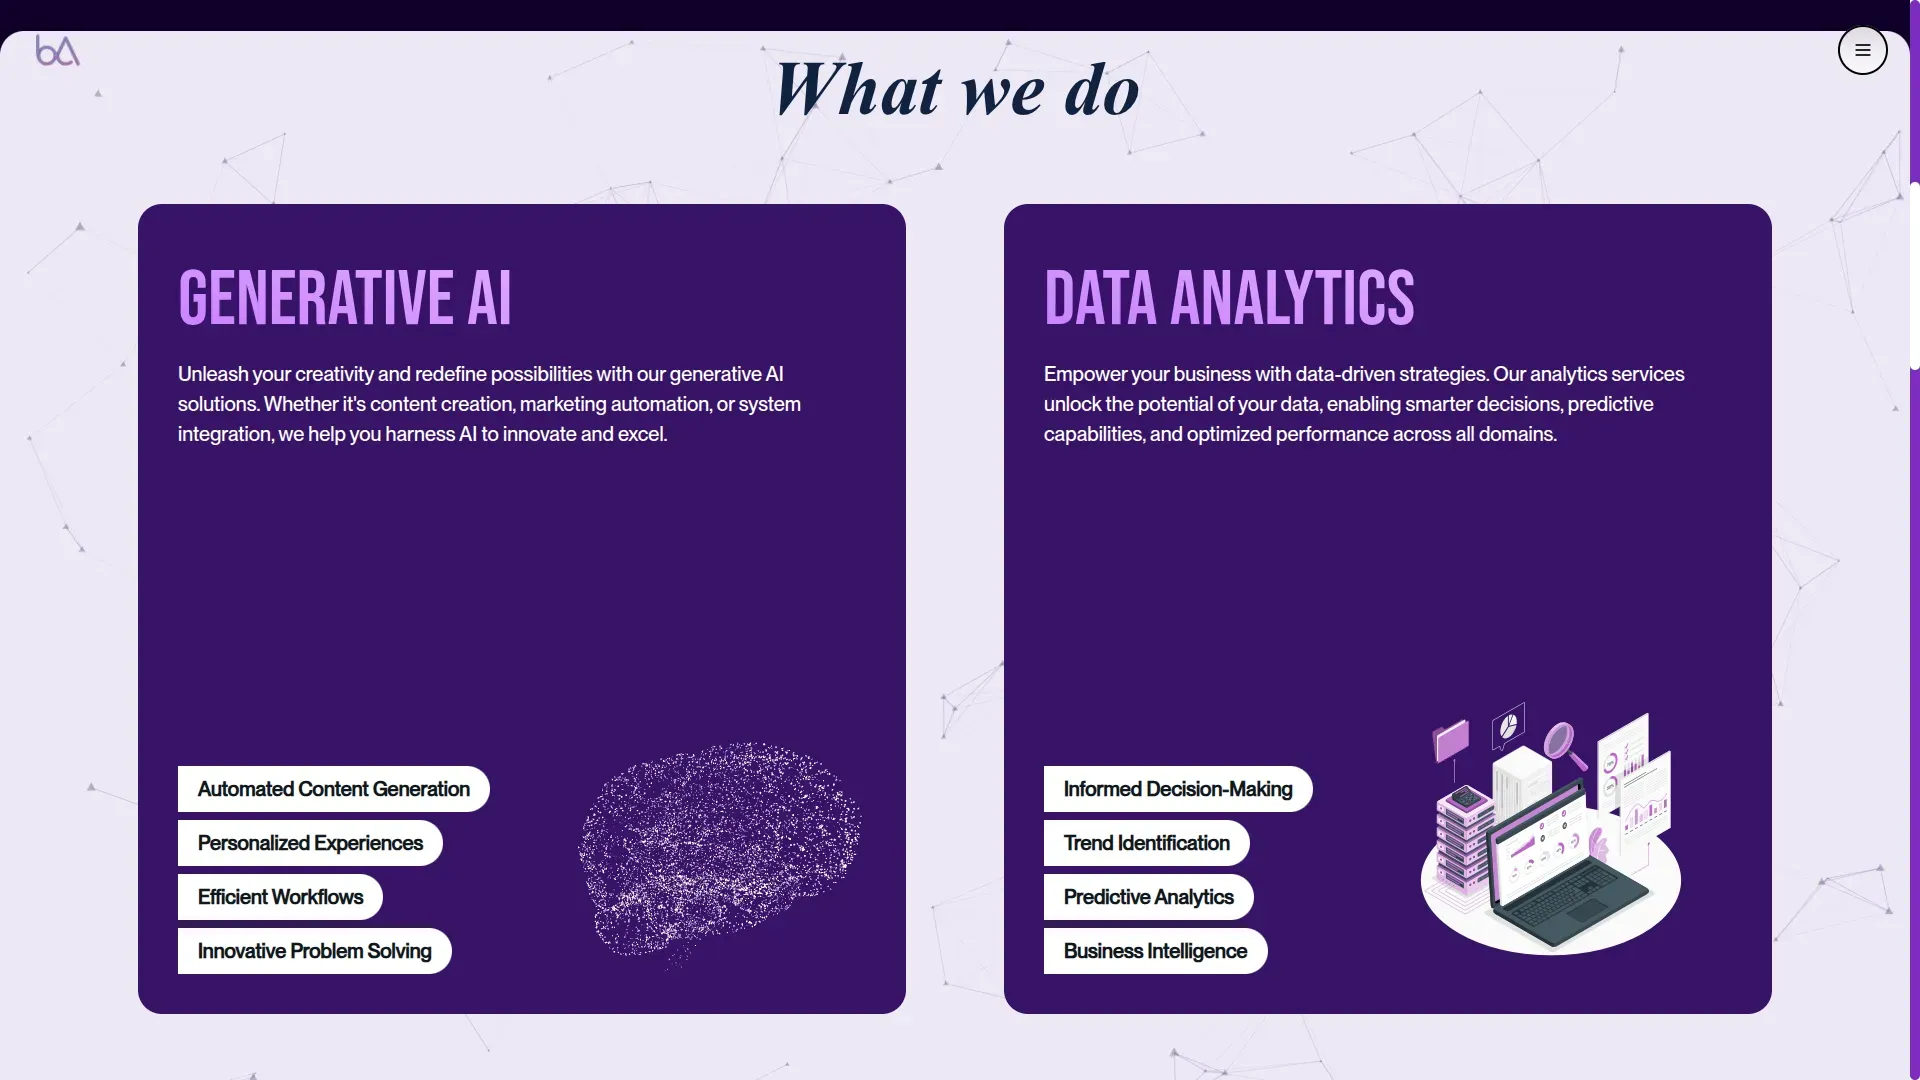
Our Solution
We developed interactive data visualizations and clear information architecture to make complex concepts accessible while showcasing the technical prowess of the platform.
The Results
+78%
User Engagement
+45%
Product Demo Requests
+92%
B2B Leads
User Research & Strategy
We conducted extensive research with business decision-makers to understand how they currently evaluate data analytics solutions and what barriers they face in adoption.
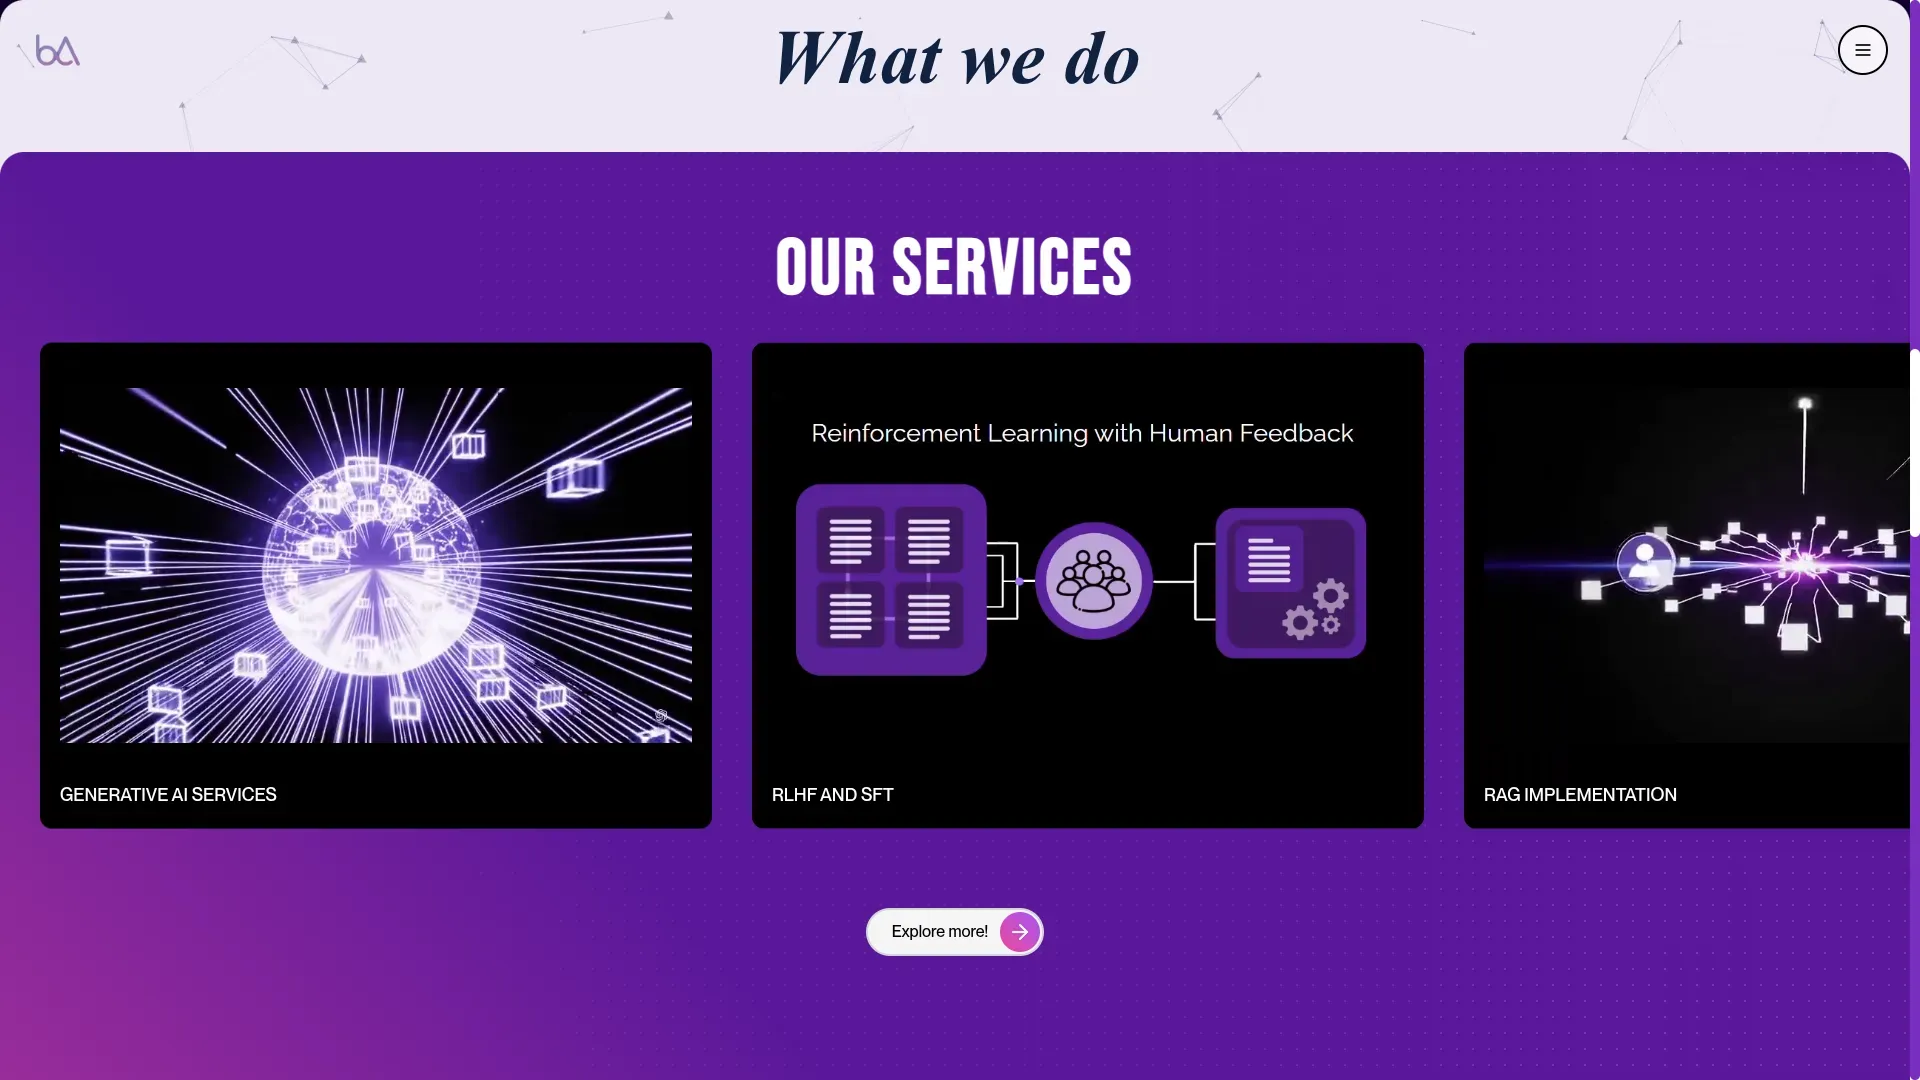
Data Visualization Design
We designed custom interactive visualizations that make complex data relationships immediately understandable to business users, while still conveying the sophistication of the technology.
Data Visualization Design
We designed custom interactive visualizations that make complex data relationships immediately understandable to business users, while still conveying the sophistication of the technology.
Data Visualization Design
We designed custom interactive visualizations that make complex data relationships immediately understandable to business users, while still conveying the sophistication of the technology.
Data Visualization Design
We designed custom interactive visualizations that make complex data relationships immediately understandable to business users, while still conveying the sophistication of the technology.
Data Visualization Design
We designed custom interactive visualizations that make complex data relationships immediately understandable to business users, while still conveying the sophistication of the technology.
Data Visualization Design
We designed custom interactive visualizations that make complex data relationships immediately understandable to business users, while still conveying the sophistication of the technology.